
The Business Case for Pump System Assessment
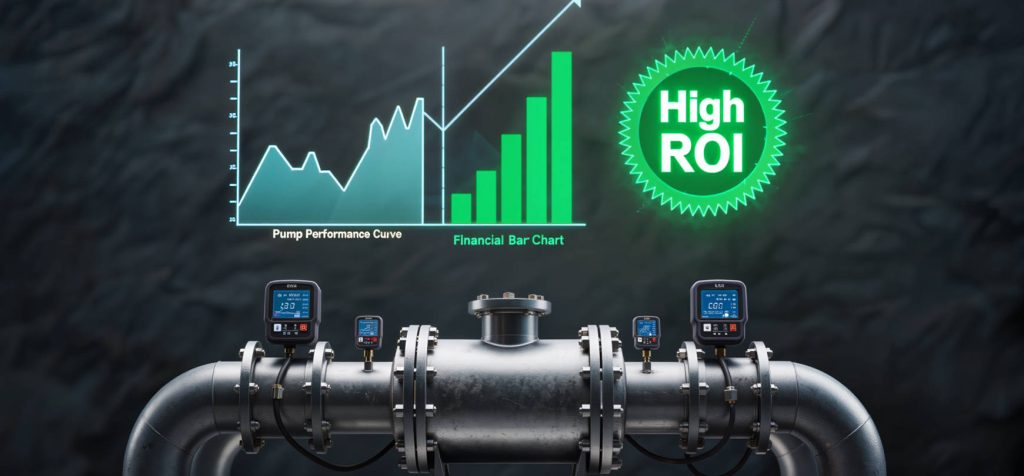
When a pumping system is not optimized, the cost shows up in three places: the maintenance budget (unplanned repairs, premature component replacement), the energy bill (15-30% higher than an optimized system), and production losses (unplanned downtime, reduced throughput, inconsistent product quality). A structured pump system assessment identifies the systems where optimization will deliver the greatest return on investment—typically 20-50% energy reduction with payback periods measured in months, not years.
Why Assess? The Numbers
The U.S. Department of Energy estimates that pumping systems account for 25% of industrial motor energy consumption, and that 20-30% of that energy could be saved through system optimization. For a mid-sized chemical plant with $800,000 in annual pump energy costs, that represents $160,000-$240,000 in potential annual savings—equivalent to the cost of 3-5 new ANSI process pumps.
The Four Phases of a Pump System Assessment
Phase 1: Prescreening—Find the Biggest Opportunities First
Most plants have hundreds of pumps. Assessing all of them is neither practical nor cost-effective. Prescreening prioritizes pumps based on simple, high-impact criteria:
- Motor horsepower (start with pumps above 25 hp—they consume the most energy)
- Annual operating hours (focus on pumps running 4,000+ hours/year)
- Control method (throttled control valves are the #1 indicator of optimization potential)
- Maintenance history (repeat failures signal a system problem, not a component problem)
- Criticality (unspared pumps whose failure stops production justify deeper analysis)
Phase 2: Assemble the Assessment Team
A pump system assessment requires cross-functional expertise. The minimum team includes: a process engineer who knows the system requirements, a maintenance/reliability engineer with pump mechanical knowledge, an electrician or electrical engineer for motor and VFD expertise, and an operator who understands how the system actually runs day-to-day (as opposed to how the P&ID says it runs). For large or complex systems, a certified Pump System Assessment Professional (PSAP) or an outside consultant brings specialized measurement and analysis capabilities.
Phase 3: Measurement, Data Gathering, and Analysis
This is where the real work happens. For each prioritized pump system, collect:
- Operating data: Flow rate, suction and discharge pressures, motor amps/volts/power factor, pump speed. Measure at normal, minimum, and maximum operating conditions.
- System data: Static head (elevation + pressure), piping configuration (diameters, lengths, fittings), control valve position and type, end-use equipment pressure/flow requirements.
- Pump data: Manufacturer’s published curve, installed impeller diameter, NPSHr curve, efficiency curve.
Plot the pump curve against the measured system curve. The analysis reveals: Is the pump operating in its POR? Is the control valve dissipating excess head? Is NPSH margin adequate across the full operating range? Is the pump efficiency at the actual operating flow acceptable relative to the BEP efficiency?
Phase 4: Reporting and Recommendations
The assessment report should prioritize recommended actions by ROI, not by technical elegance. A simple impeller trim with a 4-month payback should be listed before a full VFD installation with a 3-year payback, even if the VFD offers larger absolute savings. Each recommendation should include: estimated implementation cost, projected annual energy and maintenance savings, payback period, and any impact on process reliability or product quality.
Considering a Pump System Assessment?
Our application engineers can help you prescreen your pump population and scope an assessment for your highest-opportunity systems. We provide the pump performance data and replacement/trim options needed to quantify potential savings.
The Two Steps After the Assessment
The assessment is not the endpoint—it is the foundation for action. Two critical follow-up steps ensure the assessment delivers real value:
- Implementation: Execute the recommended changes—impeller trims, VFD installations, pump replacements, piping modifications. Prioritize the actions with the fastest payback to build organizational momentum and credibility for the larger investments.
- Measurement and Verification (M&V): After implementing each change, measure the actual energy consumption and compare it to the pre-optimization baseline. M&V closes the loop: it validates the savings, justifies the investment to management, and provides data for future assessments.
Key Takeaways
- Prescreening is the essential first step—focus assessment resources on the 10-20% of pumps that consume 80% of the energy and maintenance budget.
- A pump system assessment is a team sport; no single discipline has all the answers. Include process, mechanical, electrical, and operations perspectives.
- Prioritize recommendations by payback period, not absolute savings—fast wins build organizational support for larger investments.
- Measurement and verification after implementation is not optional—it proves the ROI and guides future optimization decisions.