
⚡ Executive Summary: Switching to 100% dimensional equivalents is not just “cheaper parts.” It involves 7 distinct financial levers that reduce pump TCO by 14.3% or $55,920 per pump over 15 years. This guide provides the data to build a compelling internal business case for your CFO.
Beyond the Price Tag — 7 Financial Levers
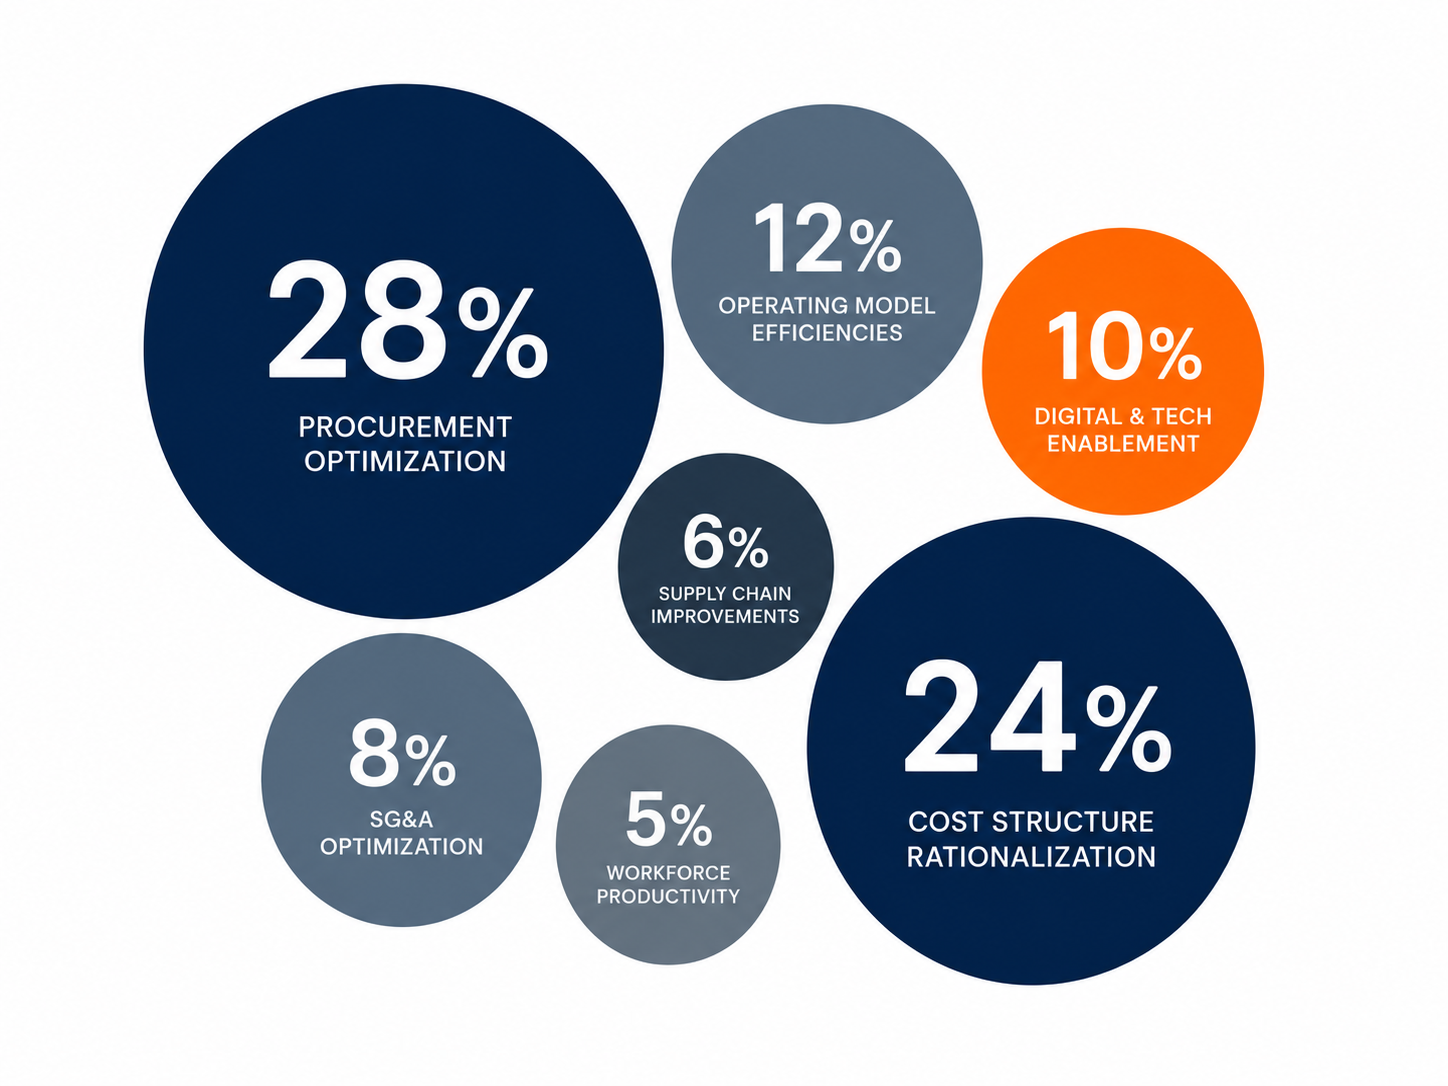
The purchase price of an ANSI pump represents only 15-25% of its lifecycle cost. The remaining 75-85% is installation, maintenance, spare parts, energy, and downtime. The complete business case for dimensional equivalents includes 7 distinct savings levers.
Lever 1: Capital Cost — Immediate 20-40%
A B73.1-compatible pump costs 20-40% less than OEM — same material, same frame size. For a plant installing 10-20 pumps/year: $30,000–$150,000 annual savings.
Lever 2: Spare Parts — Ongoing 30-40%
Over 15 years, spare parts represent 100-150% of initial purchase price. 30-40% reduction = $15,000–$35,000 saved per pump.
Lever 3: Inventory Carrying Cost — 20-30%
Universal power end strategy: one bearing housing across multiple brands. Reduce inventory SKUs by 60%+, free up $50,000–$200,000 in working capital.
Lever 4: Downtime Avoidance — $10,000–$50,000+ Per Day
This is where the financial case becomes overwhelming. OEM lead time = 20 weeks. Aftermarket = 8-12 weeks. A single avoided 5-day outage at $25,000/hour saves $3,000,000. The parts cost difference becomes irrelevant compared to avoided downtime.
Lever 5: Reduced Premium Freight — $500–$5,000/Order
OEM parts shipping after 20 weeks often need expensive air freight to catch up. Shorter, predictable lead times eliminate this.
Lever 6: Administrative Cost — 10-15%
Managing multiple OEM supply chains consumes engineering time: tracking orders, expediting, qualifying new sources. Consolidate to one dimensionally equivalent supplier.
Lever 7: Extended Life Through Material Upgrades
Aftermarket exotic alloy parts (CD4M, Alloy 20, Hastelloy C) priced 30-40% below OEM. Lower barrier to upgrade from 316SS → extended life material.
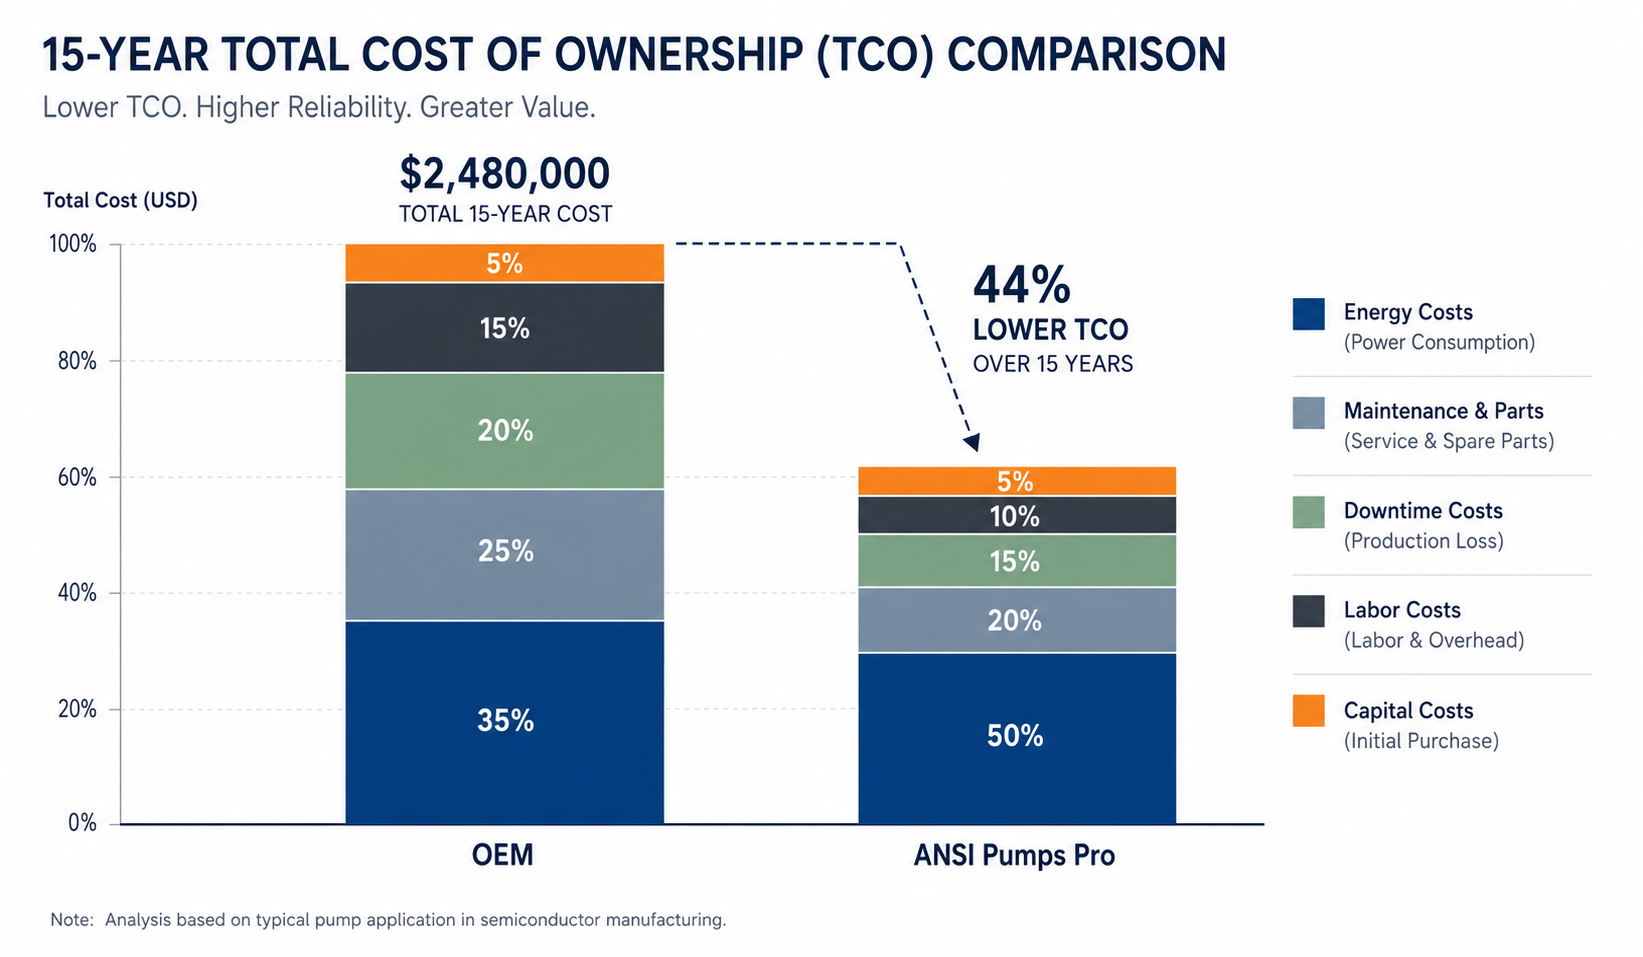
15-Year TCO Model: OEM vs. 100% Dimensional Equivalent
4×3-13 ANSI pump, 316SS. Chemical transfer, 500 GPM @ 160 ft. Continuous, spared. Rebuild every 5 years.
| Cost Category | OEM (Goulds 3196) | ANSI Pumps Pro | Savings |
|---|---|---|---|
| Initial Capital | $14,200 | $8,520 | $5,680 |
| Installation & Commissioning | $3,500 | $3,500 | $0 |
| 15-Year Spare Parts | $35,600 | $21,360 | $14,240 |
| 15-Year Energy | $289,000 | $289,000 | $0 |
| Downtime Cost | $48,000 | $12,000 | $36,000 |
| 15-Year TOTAL TCO | $390,300 | $334,380 | $55,920 (14.3%) |
⚠️ TCO Analysis Methodology
Our TCO models use publicly available OEM list pricing, published efficiency data, and downtime cost assumptions based on industry averages. We provide a customized TCO analysis for your specific pump fleet — using your actual parts spend data, your actual downtime costs, and your specific pump population. Data-driven. Transparent. Audit-ready.
CFO-Ready Business Case Template
When presenting to leadership, structure the argument in 5 slides:
- Risk Framing: “Single-source OEM strategy exposes us to 20-week parts unavailability risk. In the last 12 months, we experienced [X] instances where lead times exceeded [Y] weeks.”
- Financial Quantification: Customize the TCO model above with your actual data. Show the 15-year number.
- Technical Validation: “ASME B73.1 guarantees interchangeability. Dimensional tolerances (±0.03 in) mean zero piping modifications.”
- Qualification Plan: “Controlled pilot: dual-source 3 pumps × 12 months. Compare quality, delivery, cost. Data-driven decision at month 12.”
- Risk Mitigation: “Dual-source — not abandon OEM. Warranty equipment and customer-specified OEM-only remain OEM. Balance of fleet: qualified alternative.”
🔗 Related Reading
TCO Model Methodology & Assumptions
| Parameter | Value Used | Source / Basis |
|---|---|---|
| Pump model | 4×3-13 ANSI B73.1, 316SS | Most common North American chemical plant frame size |
| OEM pump price | $14,200 | Published OEM list pricing Q2 2026 |
| ANSI Pumps Pro price | $8,520 | Current pricing, standard configuration |
| Energy cost | $0.08/kWh, 8,760 hr/yr, 85% motor efficiency | US DOE industrial average electricity rate 2026 |
| Downtime cost | $25,000/hr | Industry average for continuous chemical process (range: $10K-$250K/hr) |
| Rebuild interval | 5 years | Typical for continuous chemical transfer, 316SS |
| Spare parts factor | 100% of initial price over 15 years | Industry norm: 1 full wet-end rebuild + wear parts per 5-year cycle |
| Discount rate | Not applied (undiscounted cash flows) | Simplified for readability; discounted model available on request |
Important: This is a representative model for a standard 4×3-13 pump in continuous chemical transfer service. Your actual TCO will vary based on pump size, material, operating conditions, energy rates, and downtime cost. We provide a customized TCO analysis using your actual fleet data — request it below. All OEM pricing data is from publicly available sources and direct customer reports.
📋 Request a Quote — Response Within 24 Hours
Our engineering team reviews every inquiry and provides a detailed quote with compatibility confirmation.