
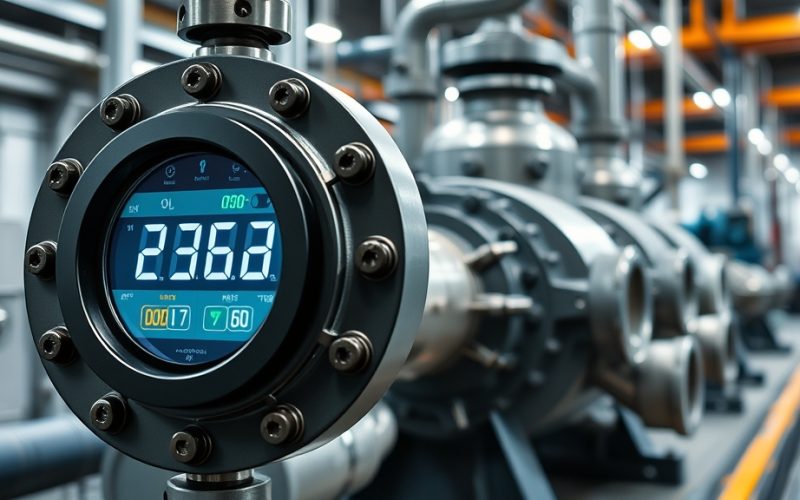
Flow rate—the volume of fluid a centrifugal pump moves per unit time—is the single most important performance metric in any pumping system. Whether you are sizing a new Goulds 3196 for a chemical transfer application, verifying that an installed Durco Mark III is meeting its process duty point, or diagnosing why a pump is no longer delivering design flow, understanding how to calculate, predict, and verify flow rate is essential. This engineer’s guide walks you through the core formula, a real industrial worked example, the affinity laws, factors that degrade actual flow, and a comprehensive reference table of design flow rates across common ANSI B73.1 pump frame sizes.
1. The Core Flow Rate Formula
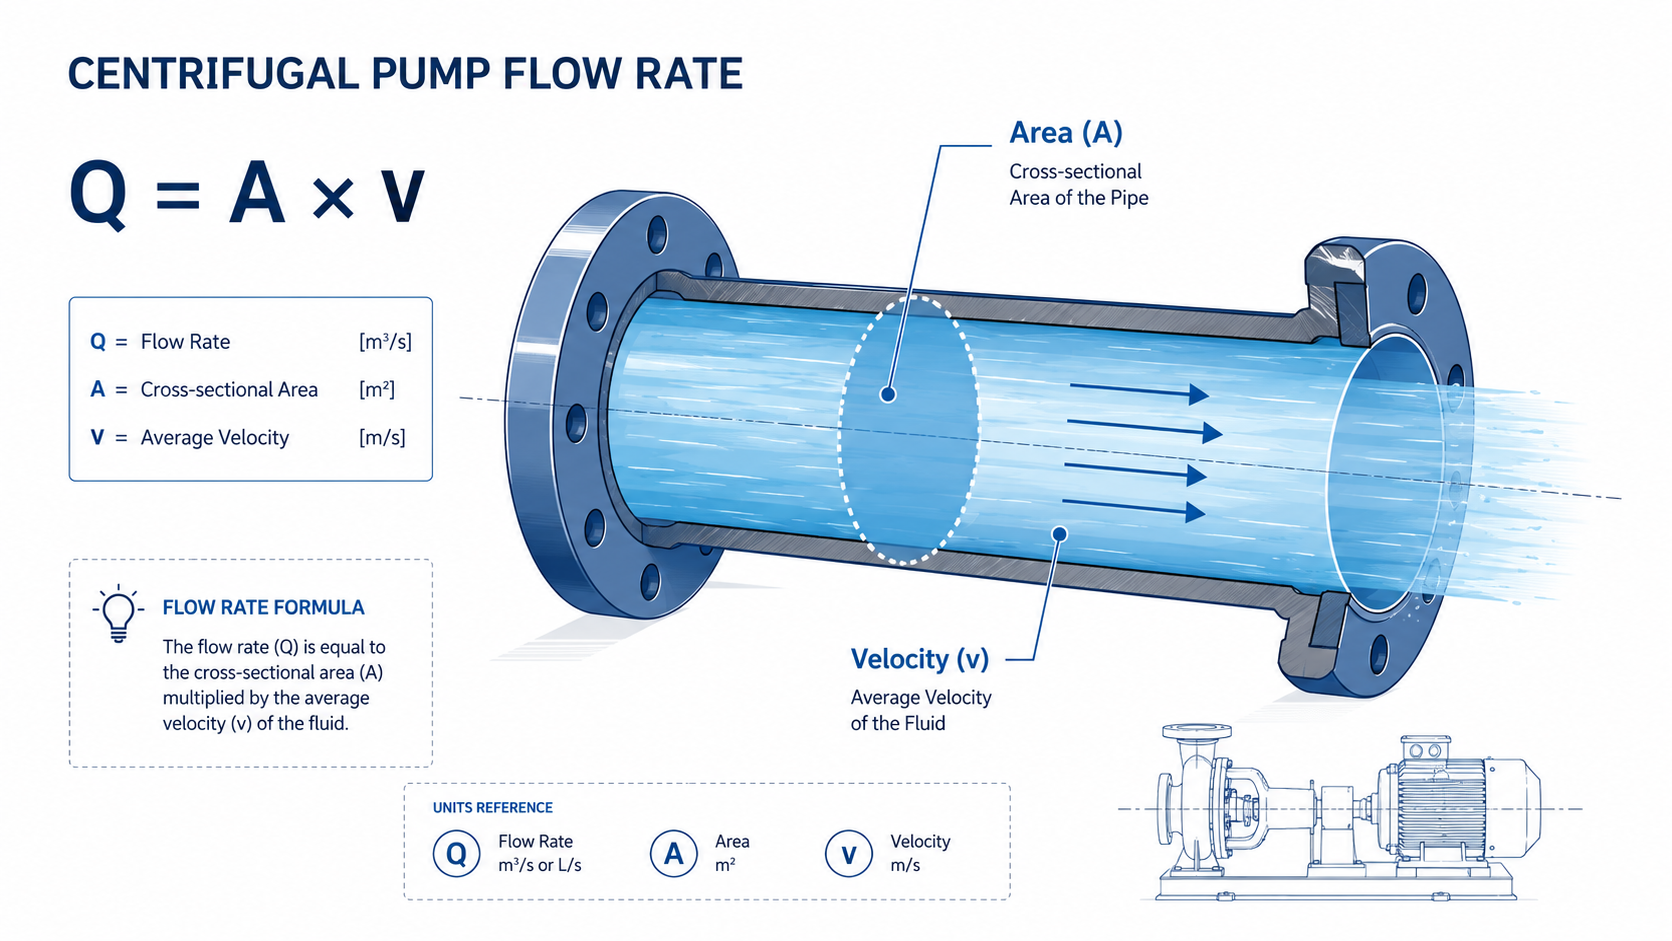
Volumetric flow rate through any pipe or pump nozzle is the product of the cross-sectional area and the average fluid velocity. For a circular discharge nozzle—standard on all ANSI B73.1 centrifugal pumps—the formula is:
Q — volumetric flow rate
A — cross-sectional area
D — pipe inside diameter
v — average fluid velocity
Volumetric Flow Rate = Cross-Sectional Area × Average Fluid Velocity
Where each term represents a measurable physical quantity:
| Symbol | Parameter | Metric (SI) Units | US Customary Units | How to Measure |
|---|---|---|---|---|
| Q | Volumetric flow rate | m³/h (or L/s) | GPM (gallons per minute) | Flow meter, pump curve intersection |
| A | Cross-sectional flow area | m² | ft² (or in²) | Calculated from pipe/nozzle ID |
| D | Internal pipe/nozzle diameter | meters (m) | inches (in) or feet (ft) | Caliper measurement or pipe schedule table |
| v | Average fluid velocity | m/s | ft/s | Ultrasonic flow meter, pitot tube |
2. Practical Velocity Guidelines for ANSI Centrifugal Pumps
Selecting the right target velocity is as important as the formula itself. For chemical process fluids in ASME B73.1 pumps, industry practice recommends:
- Suction piping: 1–2 m/s (3–6 ft/s)—keeping suction velocity low minimises NPSH losses and reduces the risk of cavitation
- Discharge piping: 2–4 m/s (6–12 ft/s)—higher velocities are acceptable on the discharge side but must be balanced against friction losses
- High-viscosity fluids (>100 cP): Reduce velocities by 30–50% to compensate for increased pipe friction and impeller slip
- Slurries and solids-bearing fluids: Maintain a minimum of 1.5–2 m/s to prevent solids settling; maximum velocity limited by erosion rate of the pipe material
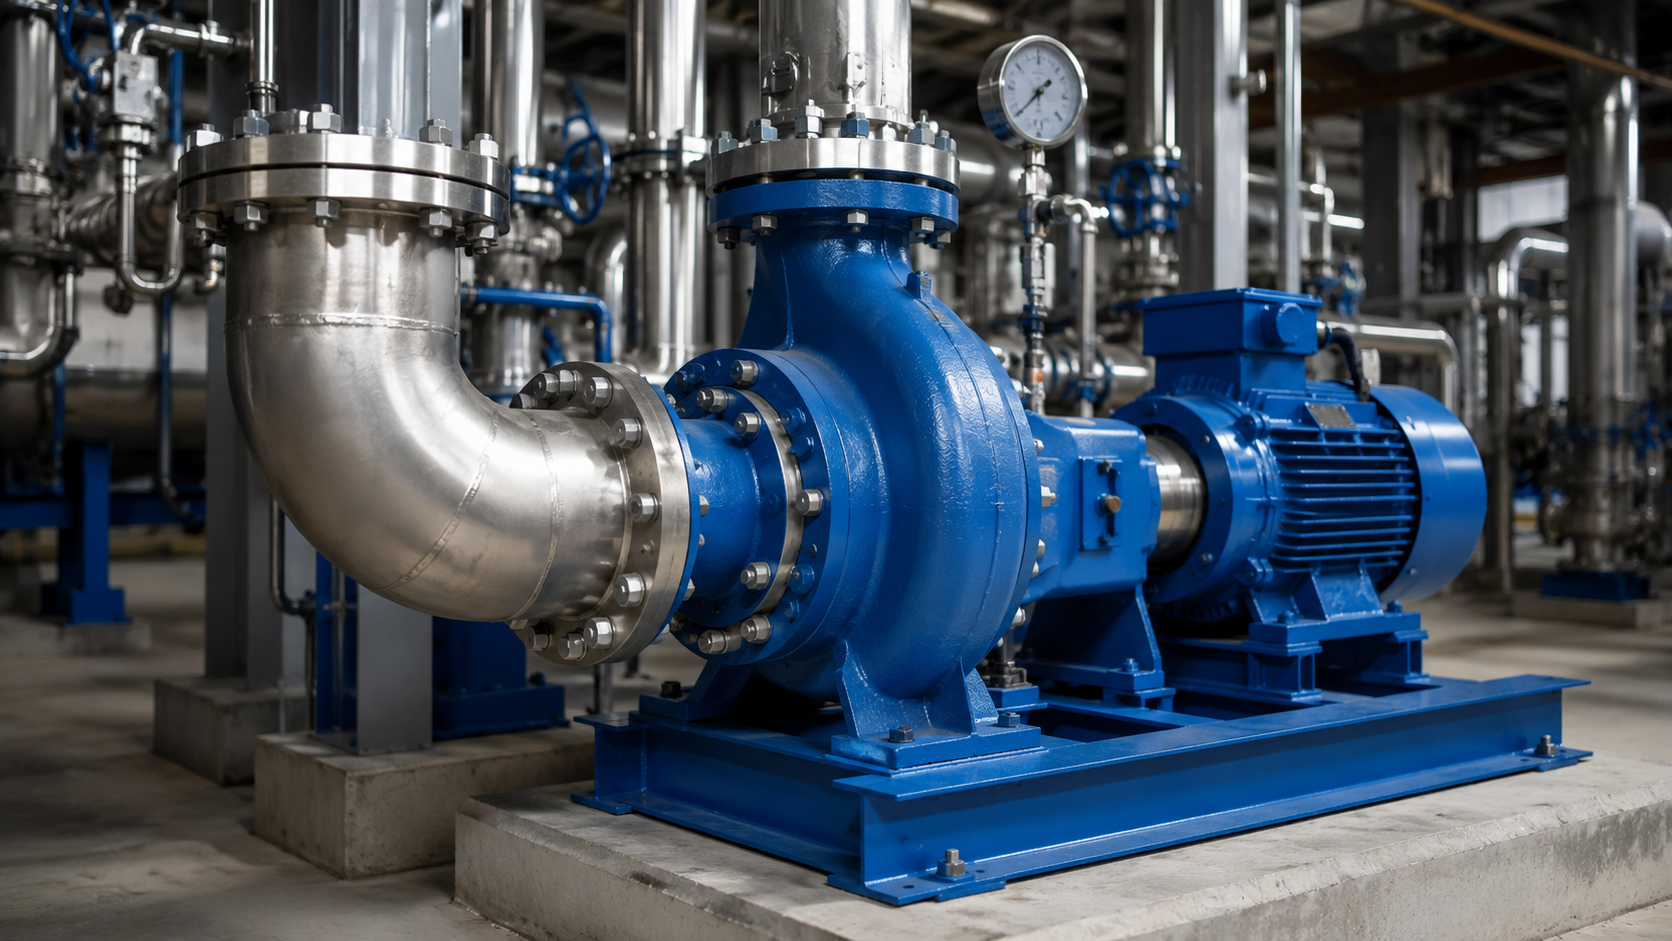
For Goulds 3196 and Durco Mark III ANSI pumps, the discharge nozzle is sized per ASME B73.1 to keep velocities within these ranges at the pump’s best efficiency point (BEP). Operating far from BEP—below 50% or above 120% of BEP flow—not only reduces efficiency but accelerates wear ring and bearing wear.
3. Worked Example: Goulds 3196 MTX in Chemical Transfer Service
Let’s calculate the expected flow rate for a Goulds 3196 MTX 3×4-13 ANSI process pump handling demineralised water at 20°C in a chemical plant transfer application. This is one of the most common frame sizes in North American chemical service.
Given data:
- Discharge nozzle: 3-inch Schedule 40 (internal diameter = 3.068 in = 0.0779 m)
- Average discharge velocity (measured by clamp-on ultrasonic meter): 3.5 m/s (11.5 ft/s)
- Fluid: Water at 20°C (density = 998 kg/m³, viscosity ≈ 1.0 cP)
- Pump speed: 3550 RPM (60 Hz motor, direct-coupled)
- Impeller diameter (as installed): 12.25 in (trimmed from max 13.0 in)
Step 1 — Metric calculation (SI units):
D = 3.068 in × 0.0254 = 0.0779 m
A = π × (0.0779)² ÷ 4 = 3.1416 × 0.00607 ÷ 4 = 0.00477 m²
Q = A × v = 0.00477 × 3.5 = 0.01670 m³/s
Step 2 — US customary calculation:
D = 3.068 in ÷ 12 = 0.2557 ft
A = π × (0.2557)² ÷ 4 = 3.1416 × 0.06537 ÷ 4 = 0.05133 ft²
Q = A × v = 0.05133 × 11.5 = 0.5903 ft³/s
Cross-check: 60.1 m³/h × 4.403 GPM/(m³/h) = 264.7 GPM ✓ — excellent agreement with the US calculation. This flow rate falls well within the 3×4-13 frame’s hydraulic coverage, with BEP around 440 GPM at full impeller diameter. The trimmed impeller (12.25 in vs. 13 in max) shifts the BEP flow proportionally lower, which is consistent with the calculated 265 GPM.
Practical insight: If this pump were handling a process fluid with viscosity of 50 cP (e.g., a light hydrocarbon or warm glycol), the Hydraulic Institute’s viscosity correction method (ANSI/HI 9.6.7) would recommend multiplying the water-based flow by a correction factor of approximately 0.94—reducing the expected flow to roughly 56.5 m³/h (249 GPM). Always apply viscosity corrections when the pumped fluid exceeds 5–10 cP; neglecting this can lead to undersized motors and missed process targets.
4. How Flow Rate Changes: The Affinity Laws
The affinity laws describe how centrifugal pump performance changes with rotational speed and impeller diameter. For engineers adjusting VFD setpoints or specifying trimmed impellers, these relationships are indispensable:
Affinity Law 1 — Speed Change: Q₁ / Q₂ = n₁ / n₂
Flow is directly proportional to pump speed. Reduce speed by 20% → flow reduces by 20%.
Affinity Law 2 — Impeller Diameter Change: Q₁ / Q₂ = D₁ / D₂
Flow is directly proportional to impeller diameter. Trim impeller from 13″ to 11.7″ → flow reduces by 10%.
Critical companion relationships — while flow changes linearly with speed, the other performance parameters follow different power relationships:
| Parameter | Relationship to Speed (n) | Relationship to Diameter (D) | Example: Speed reduced from 3550 to 2840 RPM (−20%) |
|---|---|---|---|
| Flow (Q) | Q ∝ n¹ | Q ∝ D¹ | ↓ 20% |
| Head (H) | H ∝ n² | H ∝ D² | ↓ 36% |
| Power (P) | P ∝ n³ | P ∝ D³ | ↓ 49% |
Why this matters: A seemingly conservative 20% speed reduction cuts power consumption by nearly half. This is why VFD-controlled pumps deliver substantial energy savings in variable-demand applications—and why impeller trimming decisions must account for the cubic impact on power draw.
5. Factors That Reduce Actual Flow Rate
The formula Q = A × v gives you the theoretical flow. In a real chemical plant, six factors routinely pull actual flow below the calculated value—some gradually, some suddenly. Understanding each one helps you pinpoint the root cause when a pump no longer meets its process target:
| Factor | Mechanism | Typical Flow Loss | Detection Method |
|---|---|---|---|
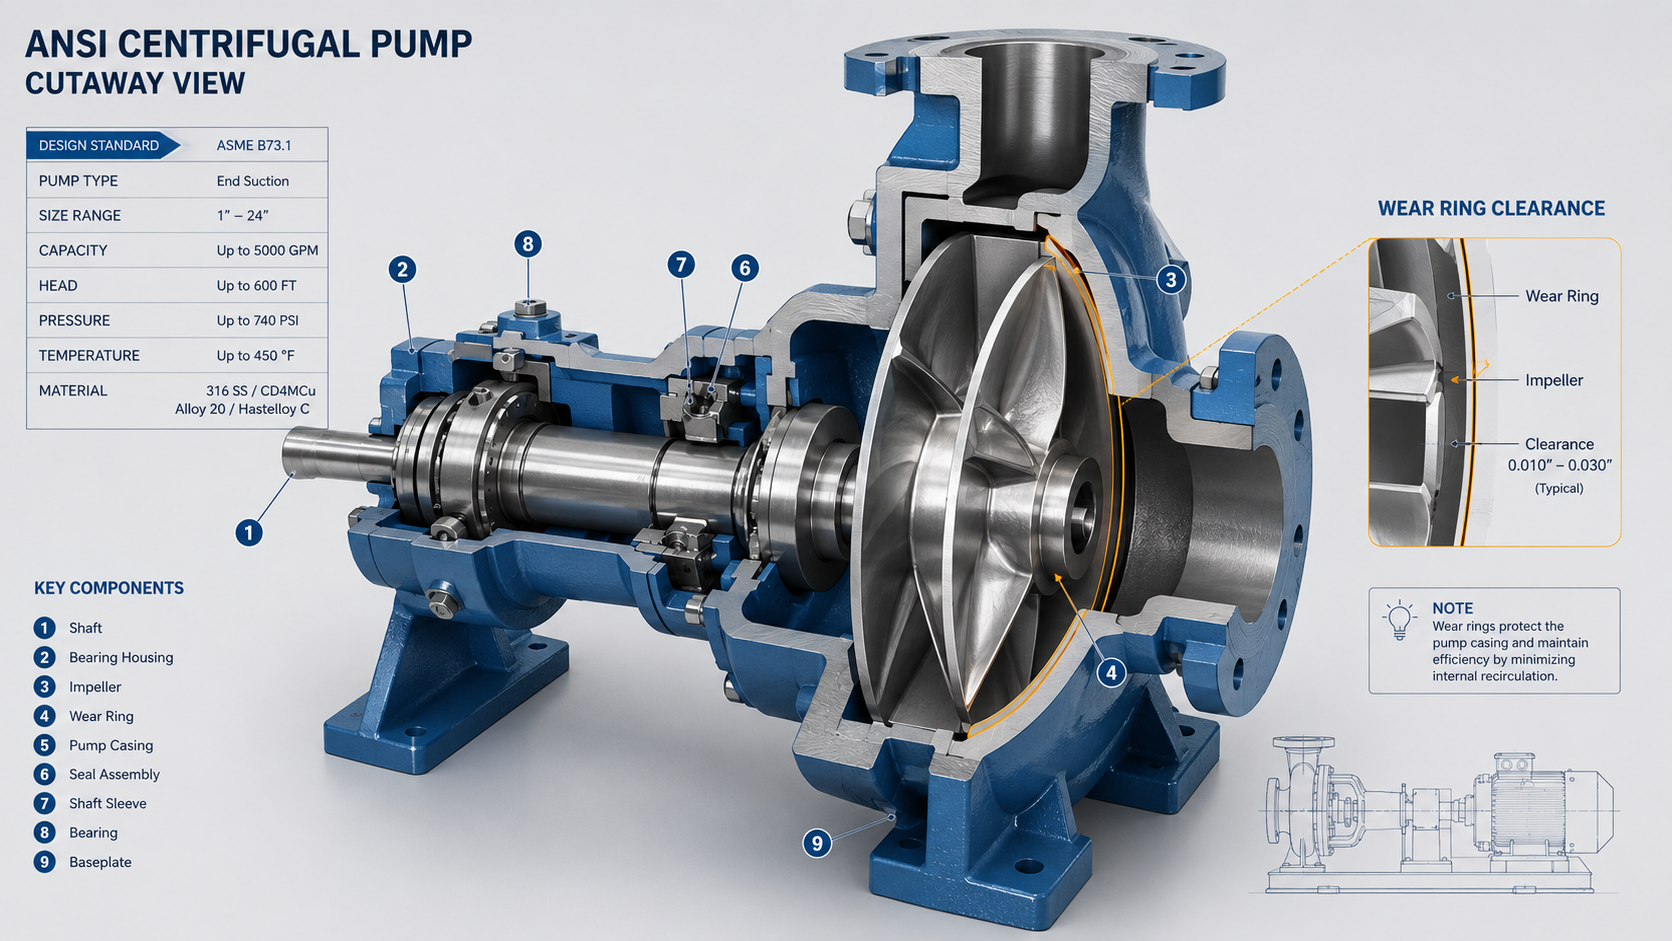
| Wear ring clearance | Internal recirculation from discharge back to suction across worn clearance gap | 3–15% (worsens progressively) | Compare discharge pressure at same valve position over time; measure clearance during teardown |
| Fluid viscosity | Increased disc friction and impeller slip at viscosities above 5–10 cP | 5–25% (fluid-dependent) | Apply ANSI/HI 9.6.7 correction factors; compare to water baseline |
| System curve shift | Fouled heat exchangers, partially closed valves, or pipe scale increase system resistance | 10–30% | Measure differential pressure across pump vs. system; calculate system resistance coefficient |
| Entrained gas | Even 2–3% gas by volume in the suction line reduces pump head and can cause loss of prime | 5–50% (gas % dependent) | Visual sight glass on suction; abnormal noise/vibration; fluctuating discharge pressure |
| Impeller erosion/corrosion | Vane thinning or material loss reduces energy transfer to fluid; outlet geometry altered | 5–20% | Borescope inspection; reduced discharge head at same flow; metallic debris in strainer |
| Insufficient NPSH margin | Cavitation bubbles collapse in impeller eye, disrupting flow and damaging metal surfaces | 5–15% before visible damage | Crackling noise (like gravel); suction pressure gauge fluctuation; pitting on impeller eye |
Field diagnosis tip: When actual flow is below expected and you don’t have immediate access to a teardown, measure three things: (1) suction pressure at the pump inlet flange, (2) discharge pressure at the pump outlet flange, and (3) motor amps. Compare all three to the pump’s factory test curve at the same RPM. If head is low but amps are normal, suspect wear ring clearance. If amps are high, suspect a system curve shift (you are running far out on the curve). If both head and amps are low with fluctuating readings, suspect entrained gas or cavitation.
6. ANSI Pump Flow Rate Reference Table
The table below provides design flow rates at Best Efficiency Point (BEP) for common ANSI B73.1 pump frame sizes. These values assume water at 20°C, full impeller diameter, and 3500 RPM (or 1750 RPM for larger frames as noted). Actual operating flow depends on your specific system curve; use these figures for initial sizing and performance benchmarking:
| ANSI Frame Size | Disch. × Suct. (in) | RPM | Max Impeller Ø (in) | Head at BEP (ft) | Design Flow at BEP (GPM) | Design Flow (m³/h) | Typical Motor (HP) |
|---|---|---|---|---|---|---|---|
| 1×1.5-6 | 1.0 × 1.5 | 3500 | 6.0 | 85 | 22 | 5.0 | 3 |
| 1×1.5-6 | 1.0 × 1.5 | 3500 | 6.5 | 130 | 37 | 8.4 | 5 |
| 1.5×3-6 | 1.5 × 3.0 | 3500 | 6.0 | 95 | 55 | 12.5 | 5 |
| 1.5×3-8 | 1.5 × 3.0 | 3500 | 8.0 | 190 | 85 | 19.3 | 10 |
| 2×3-8 | 2.0 × 3.0 | 3500 | 8.0 | 175 | 140 | 31.8 | 15 |
| 2×3-10 | 2.0 × 3.0 | 3500 | 10.0 | 290 | 180 | 40.9 | 20 |
| 3×4-8.5 | 3.0 × 4.0 | 3500 | 8.5 | 190 | 250 | 56.8 | 25 |
| 3×4-10 | 3.0 × 4.0 | 3500 | 10.0 | 300 | 330 | 75.0 | 30 |
| 3×4-11.5 | 3.0 × 4.0 | 3500 | 11.5 | 410 | 400 | 90.8 | 50 |
| 3×4-13 | 3.0 × 4.0 | 3500 | 13.0 | 530 | 470 | 106.7 | 60 |
| 4×6-8.5 | 4.0 × 6.0 | 3500 | 8.5 | 175 | 500 | 113.6 | 50 |
| 4×6-10 | 4.0 × 6.0 | 3500 | 10.0 | 270 | 600 | 136.3 | 60 |
| 4×6-11.5 | 4.0 × 6.0 | 3500 | 11.5 | 380 | 730 | 165.8 | 75 |
| 4×6-13 | 4.0 × 6.0 | 3500 | 13.0 | 500 | 850 | 193.0 | 100 |
| 6×8-11 | 6.0 × 8.0 | 1750 | 11.0 | 115 | 920 | 209 | 60 |
| 6×8-13 | 6.0 × 8.0 | 1750 | 13.0 | 195 | 1,150 | 261 | 75 |
| 6×8-15.5 | 6.0 × 8.0 | 1750 | 15.5 | 280 | 1,450 | 329 | 125 |
| 8×10-13 | 8.0 × 10.0 | 1750 | 13.0 | 180 | 1,850 | 420 | 125 |
| 8×10-15.5 | 8.0 × 10.0 | 1750 | 15.5 | 260 | 2,300 | 522 | 200 |
| 10×12-15.5 | 10.0 × 12.0 | 1750 | 15.5 | 230 | 3,100 | 704 | 250 |
Data source: Composite of published OEM hydraulic coverage charts for Goulds 3196, Durco Mark III, and equivalent ANSI B73.1 pump models. Values are nominal design points near BEP for water service (SG = 1.0). For viscous fluids above 5 cP, apply Hydraulic Institute correction factors (ANSI/HI 9.6.7). Consult the specific pump performance curve for exact duty-point data before finalising motor sizing or process guarantees.
7. Frequently Asked Questions
How do I calculate flow rate without a flow meter?
Measure the pump’s differential head (discharge pressure minus suction pressure, converted to feet or meters of fluid) and cross-reference with the pump’s published H-Q performance curve at the operating RPM. The intersection of the measured head with the H-Q curve gives you the operating flow. This method is accurate to within ±5% when the pump is in reasonable mechanical condition.
How does wear ring clearance affect flow rate?
As the clearance between the impeller wear ring and casing wear ring increases—typically by 0.003–0.005″ per year in clean water service, faster in abrasive or corrosive service—an increasing portion of the discharge flow recirculates back to the suction side. This internal leakage reduces net flow delivered to the process by 3–15% depending on clearance and differential pressure. A pump with worn wear rings may still show normal discharge pressure but fail to meet system flow requirements.
What is the difference between design flow and actual operating flow?
Design flow (or BEP flow) is the flow rate at which the pump achieves its highest hydraulic efficiency for a given impeller diameter and speed. Actual operating flow is determined by the intersection of the pump H-Q curve with the system resistance curve—and rarely matches BEP exactly. Continuous operation below 50% or above 120% of BEP accelerates bearing, seal, and wear ring deterioration and should be corrected via impeller trimming, VFD speed adjustment, or system modifications.
Can I use the flow rate formula for viscous fluids?
Yes, but with a critical caveat: the formula Q = A × v gives you the pump’s geometric flow capacity. For viscous fluids above 5–10 cP, the pump’s hydraulic performance—head, flow, and efficiency—all degrade relative to the water performance curve. The Hydraulic Institute publishes correction factors (ANSI/HI 9.6.7) that adjust the water-based H-Q curve for viscosity. Typical corrections for a 3×4-13 pump handling 100 cP fluid: flow reduced by ~8%, head reduced by ~5%, efficiency reduced by ~15%. Apply these corrections before the pipe velocity calculation.
How often should I verify pump flow rate in a chemical plant?
For critical process pumps, verify flow rate at least quarterly using the differential pressure / pump curve intersection method. For pumps in non-critical transfer service, semi-annual verification is sufficient. After any impeller change, VFD reprogramming, or system modification (new heat exchanger, piping reroute), re-verify immediately. Document the baseline flow rate, head, and motor amps when the pump is first commissioned or after a wet-end rebuild—this baseline is your most valuable diagnostic reference.
If your Goulds 3196, Durco Mark III, or equivalent ANSI pump is no longer meeting its design flow—and you have ruled out system-side issues—worn wet-end components are the most likely cause. We supply 100% dimensionally interchangeable impellers, casings, wear rings, and wet-end kits in 316SS, CD4MCuN, Hastelloy C-276, Alloy 20, Titanium, and Nickel.
Related Reading
About ANSI Pumps Pro
Our engineering team has 10+ years of experience in ASME B73.1 process pump design, manufacturing, and aftermarket solutions. We supply 100% dimensionally interchangeable replacement components for Goulds 3196, Durco Mark III, and other ANSI pump brands—backed by certified Material Test Reports (MTRs), CMM dimensional inspection reports, and hydrostatic test certificates (1.5× MAWP). Full material traceability from heat number to your receiving dock. Contact our team →
Editorial standards: Technical content is reviewed by senior pump engineers with direct field experience across chemical, petrochemical, and industrial applications. Claims reference published industry standards (ASME B73.1, ASTM, ANSI/HI 9.6.7) and internal engineering documentation. Last updated: July 2026.

